What's Your Wealth Distribution Story?

I’ve mentioned before that a key part community-minded personal finance is awareness of context. In this article, I discuss one of the biggest context elements of all when it comes to personal finance: the structure of wealth distribution. I suggest that differences between the facts of wealth distribution, and the stories we tell about wealth distribution, can cause both personal and collective money trauma. I also point out that there's an elephant in the room and (spoiler!) it's the field of personal finance itself.
This is essay #3 in my series on topics related to community-minded personal finance, here’s essay #1 and essay #2.
Money stories and money trauma
In most personal finance processes - the thoughtful and effective ones, at least - one of the first steps is some variation of exploring your personal “money stories.”
In her book, Finance for the People, Paco de Leon calls this “understanding why we’re weird about money.” Paco points out that we are all weird about money in one way or another, stating:
“In my career thus far, I’ve spoken to thousands of people about money. One common thread regardless of gender, race, sexual identity, political affiliation and scoioeconomic background is that people are weird about money. I’m sure you’re not shocked by this, of course. The recipe is perfect: negative emotions + gaps in information about the world of money and our own minds x inequality = weirdness and problems." (from Finance for the People by Paco de Leon, pg 4)
In personal finance, “money stories” usually refers to the stories we tell ourselves about money, both consciously and subconsciously. These are often related to "lessons" from our childhood - spoken and unspoken - about money and what it means. Our money stories include our beliefs about money and what kinds of feelings money brings up for us in general. Here are Paco's questions to ask yourself as a part of the process of exploring the money stories in your life.
There’s a reason why most good personal finance processes start with money stories. We happen to live in a society where it seems to be an almost universal experience to have trauma around money. Remarkably, this appears to be the case whether we have money or not.
Trauma can lead us to act in weird and irrational ways which is usually not what we want when we are trying to get our financial lives organized. Effective financial advisors recognize this and often encourage personal strategies - such as meditation, journaling, and other self-care techniques - to help people get a handle on their feelings about money.
Recognizing and processing our feelings about money is very important. I hope that is understood! And, I also hope it is understood that our feelings alone are not the full story.
Unfortunately, many financial advisors (Paco is an exception) gloss over how the reality of wealth distribution in the U.S. today is a central part of many Americans’ trauma around money.
Even fewer financial advisors are upfront about the role that the field of personal finance itself plays in perpetuating this very trauma.
This is an elephant in the room that I think deserves more attention.
Wealth distribution facts
To explain this further, let’s take a look at some facts about wealth distribution.
I’m going to use the structure of wealth distribution in the U.S. as my focus in this article, but if global wealth or a different country is more relevant to you, you can look at these distributions instead.
First, to orient and remind yourself about how wealth is distributed in the U.S, I recommend starting with this 6 minute video:
Key points from this video are summarized in this article.
The above video is from 2013, but the general structure of U.S. wealth has not changed significantly since then.
Next, I’d recommend thinking about your own household net worth - just a general estimate of everything you own minus everything you owe. Use this to determine where you are personally located on the wealth distribution spectrum. Also consider where your primary socioeconomic circles fall within the distribution of wealth.
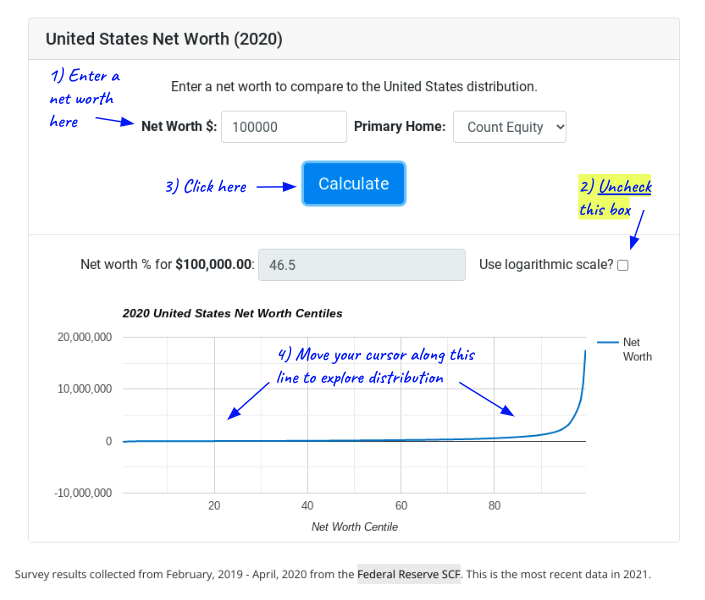
I find the resources at DQYDJ especially user-friendly for exploring questions like these. Here’s their overall net worth percentile calculator and here’s their net worth percentile calculator by age. (When you use these interactive charts, you'll need to un-select the logarithmic scale option. See my instructions at the end of this article for more detail.)
What you will notice is that the structure of wealth distribution in the U.S. looks like this:
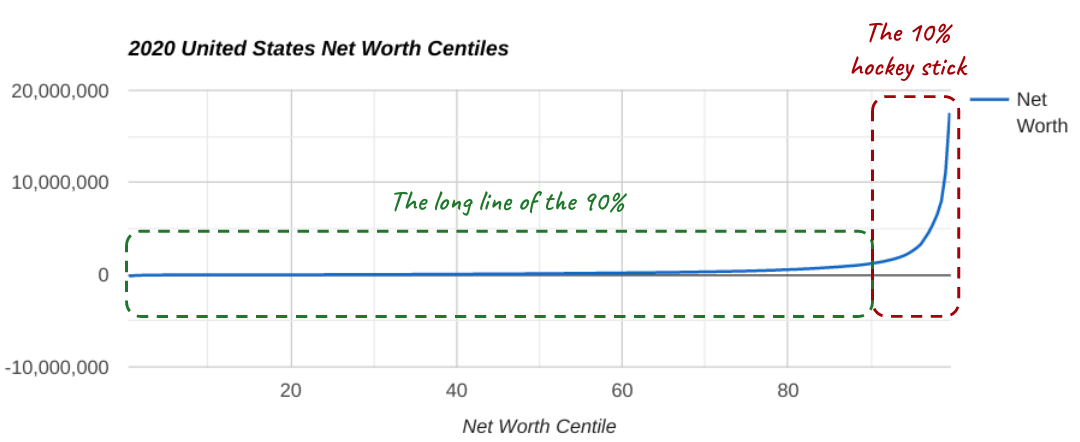
As shown, you can think of this distribution as “the long line” of the 90% and the “hockey stick” of the top 10%.
As a reminder, the chart above is not based on beliefs or opinions, it is the actual facts of how wealth is distributed in the U.S. today.
As the video I linked earlier points out, most of us believe that the structure of U.S. wealth distribution is less extreme. And, many of us think wealth should be distributed more like a linear upward sloping line.
I don’t know about you, but whenever I take the time to really look at U.S. wealth distribution charts - even though I have seen them many times before - I am shocked. And I have a lot of feelings.
Why is it so shocking to look at the actual distribution of wealth in America?
There are a lot of reasons of course. A big one is the vast disconnect between our wealth distribution reality and the stories we tell about it.
To see an example of this disconnect, let's look at some specific numbers.
What does $1.3 million mean to you?
For illustrative purposes, let’s consider the number $1.3 million.
I like exploring this number because, in my experience, most people would say: “if you have 1.3 million dollars you are definitely rich.”
However, there are some socioeconomic circles in America where the prevailing opinion is the opposite. In these circles, there is an assumption that having $1.3 million is definitely not rich. I can tell you these circles exist because I’ve been around them myself.
I can also tell you that these socioeconomic circles exist simply by looking at the way wealth is distributed in the U.S. This is because $1.3 million in household net wealth is approximately where the hockey stick begins.
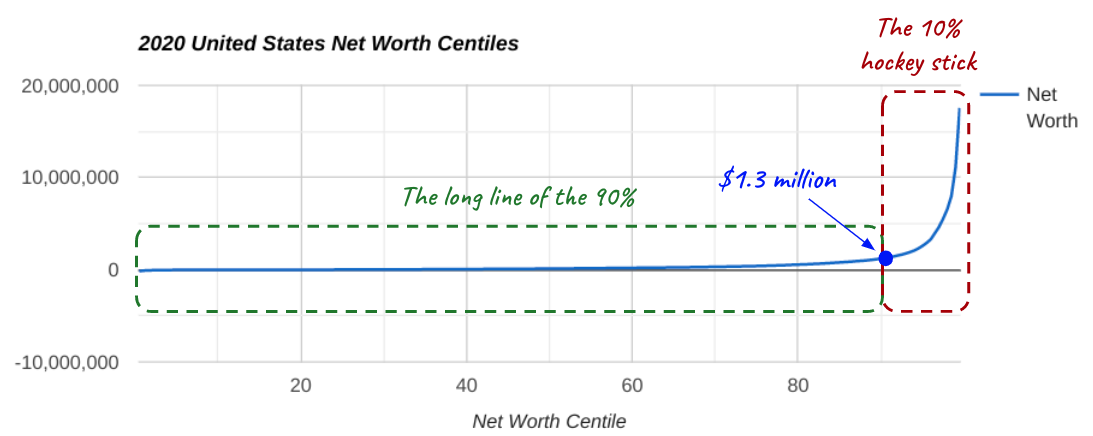
If your primary networks are mostly in the top 10% hockey stick, wealth accelerates really quickly as you move even slightly up the distribution spectrum. If you are in the top 10%, it is not unusual to know people with a lot more than $1.3 million. Like many times more, potentially. So, if your socioeconomic circle is in the top 10% hockey stick, $1.3 million appears as if it’s “definitely not rich.”
But, if your primary networks are mostly in the bottom 90%, the structure of wealth distribution looks a lot more binary. Either you're rich or you're not. And being rich is obviously being anywhere on that top 10% hockey stick. You can see that being on the hockey stick is associated with a fundamentally different relationship to wealth, and the life prospects it affords, compared to being on the long line of the 90%.
So who’s right? Is having $1.3 million actually rich or not?
Let’s look at some stats about $1.3 million.
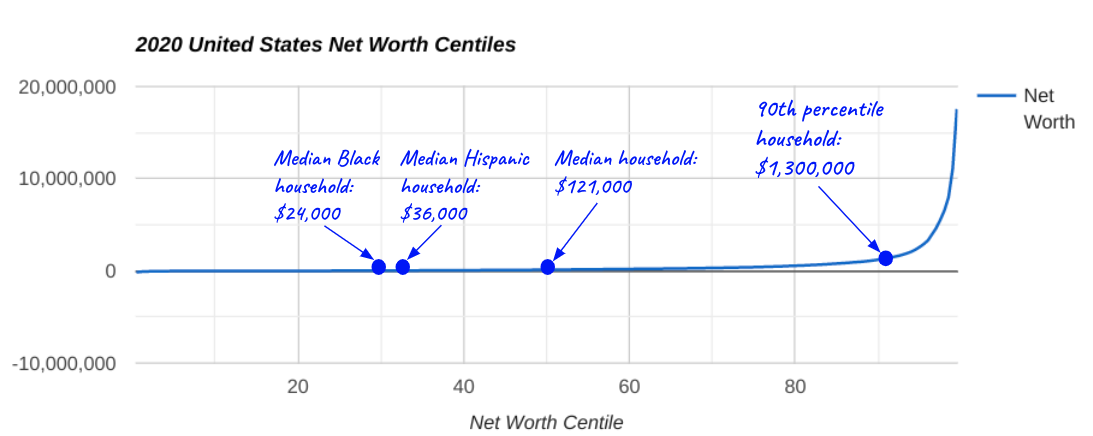
If you have $1.3 million in household net wealth, as we have just established, you have more money than 90% of American households. What's more, you have more than 10 times the wealth of the median American household - the middle household in terms of wealth in America.
In addition, if you have $1.3 million, you have 54 times the wealth of the median Black American household. YES, I said FIFTY FOUR TIMES. That is not a typo.
Also, if you have $1.3 million you have 36 times the wealth of the median Hispanic American household. That is also not a typo.
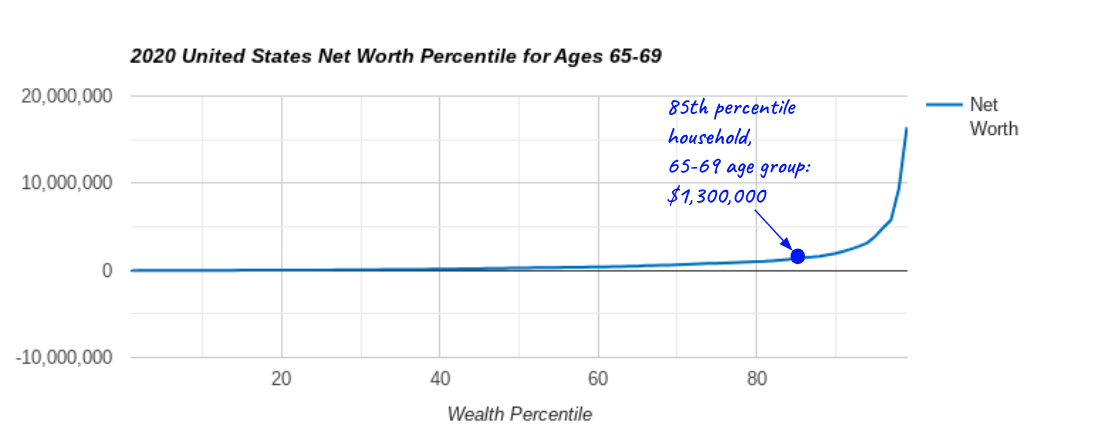
You may be thinking: “these numbers are especially extreme because we are talking about households of all ages, people accumulate more as they get closer to retirement.” You'd be correct that the wealth distribution of, for example, the 65-69 age group is slightly different (you can explore it here). But it is only slightly different. If you have $1.3 million, you still have more than 85% of households in the 65-69 age range.
So, mathematically and factually speaking, I would argue it is simply not accurate to say that $1.3 million is "not rich." If you are in a bubble where $1.3 million is considered not rich, you need to know you are in a bubble. This is important information.
But, it is information that many financial advisors seem to ignore.
Storytellers and the 4% rule
How do we keep this arrangement of wealth in the U.S. when it is not what most Americans want it to be, or believe it to be?
Once upon a time, arrangements of extreme wealth inequality were maintained through overt violence (and in some places and contexts they still are - a point I will explore in future posts, along with other ways wealth structures are maintained). These days, I would argue, an important way this arrangement of wealth continues despite the majority of Americans disagreeing with it is through the stories we tell.
And who are some of the lead storytellers? Of course there are many. But, the field of personal finance plays a notable role.
What is the story the field of personal finance tells?
Well, simply put, that the hockey stick is achievable for everyone.
If you look closely, you will notice that A LOT of personal finance advice treats $1.3 million like a perfectly reasonable minimal retirement savings goal for everyone. For example, this is baked into a common rule of thumb in personal finance: the 4% rule.
The 4% rule was developed by a financial advisor in the 1990s. While there is debate today about whether it is too high or too low, the 4% rule is regularly used as a starting point for determining the “safe” withdrawal rate of a retirement savings portfolio so that you don’t “run out of money before you die.” In fact, a significant amount of personal finance is focused on addressing this fear (a very understandable one!) that we will “run out of money before we die.”
Suggesting that you could “run out of money before you die” conveniently ignores the entire existence of Social Security which is an extraordinary benefit because of the fact that it both increases with inflation and you cannot run out of it before you die. The truth is that most Americans’ retirements are made possible by their Social Security benefits, not their personal savings (just look again at the wealth distribution charts by age if you need to prove this to yourself).
You can get an estimate of your Social Security benefits here, and it’s well worth taking a look at this if you haven’t before. People are often surprised at how much their monthly Social Security benefits are estimated to be in retirement, possibly because there is so much messaging from mainstream personal finance that we should ignore this benefit. (I know, I know, Social Security could theoretically go away because… POLITICS… and the supposed budget deficit issue... we’ll get to this in later posts, but it doesn't change my point here anyway).
If you ignore Social Security, and you apply the 4% rule, $1.3 million looks like a minimal amount to save for a modest retirement. Using the 4% rule, if you’re 65 today and have saved $1.3 million, you can theoretically only “safely” withdraw $52,000 a year through retirement and not run out of money before you die. $52,000 a year is approximately the median income today, so this is essentially saying you need $1.3 million to have a median retirement lifestyle. (Again, this is not actually true because of Social Security, but it is the implied math if you ignore Social Security like a lot of mainstream personal financial advice does).
I think that implying that $1.3 million is more or less a reasonable minimal goal for retirement savings in a society where approximately 85% of people will not reach that number is a BIG PROBLEM. It’s an elephant of a problem, and it’s in the room whether we acknowledge it or not.
Collective traumas, collective responses
I believe that living in a country where our stories about wealth distribution are out of touch from our reality of wealth distribution causes collective money trauma. I also believe that where we are personally located on the wealth distribution spectrum - based on facts, not just feelings - matters a lot.
If you share these beliefs, you can probably see that we have at least two choices.
We can seek to understand the facts of wealth distribution and recognize how these differ from our personal and collective money stories. We can acknowledge the feelings that discrepancies between our wealth distribution stories and our actual reality bring up. And, we can work to figure out what we want to do about it - both personally and collectively.
Or, we can ignore the facts of wealth distribution and live only in the fantasy land of our stories. Doing this, of course, will not make the collective trauma go away. And, as we know, trauma has a way of making itself known whether or not we recognize its existence. If we choose this path, “weird and irrational” behavior at the collective level, should not come as a surprise.
I believe the field of personal finance could play a role in helping us recognize and process our wealth distribution traumas. But first, it has to stop perpetuating misleading and traumatic money stories in the first place. Then, we need to accept that strategies for addressing collective money trauma must include collective approaches. In other words, while meditation and other self-care practices are important, they are not enough on their own.
This is a big reason for the "community" part of what I call community-minded personal finance.
Importantly, community-minded personal finance recognizes that addressing collective money trauma will require collective strategies in addition to personal strategies. Some people call this organizing. Certainly, it involves community and relationships.
Does this mean that individual personal financial decisions are not an important part of community-minded personal finance? Of course not.
Will your individual location on the wealth distribution spectrum make a difference in how you might approach community-minded personal finance? Very much so.
Are you wondering how exactly community-minded personal finance might look different depending where you are coming from on the wealth distribution spectrum? If so, please stick around. That is the topic of my next post.
How to use the net worth calculators at DQYDJ
See below for instructions for how I’d recommend using the U.S. net worth percentile calculator at DQYDJ. You can also apply these instructions to their net worth by age calculator.
Disclaimer: This is not financial advice or recommendation for any investment. The content is for informational purposes only, you should not construe any such information or other material as legal, tax, investment, financial, or other advice.